Why Email Benchmarks Mislead More Than They Help

Every marketing team wants to know whether their email campaigns are performing well. The easiest place to look is an email benchmark. Industry reports publish average open rates, click rates, and conversions, making it tempting to compare your results against a single number and assume you're ahead or behind.
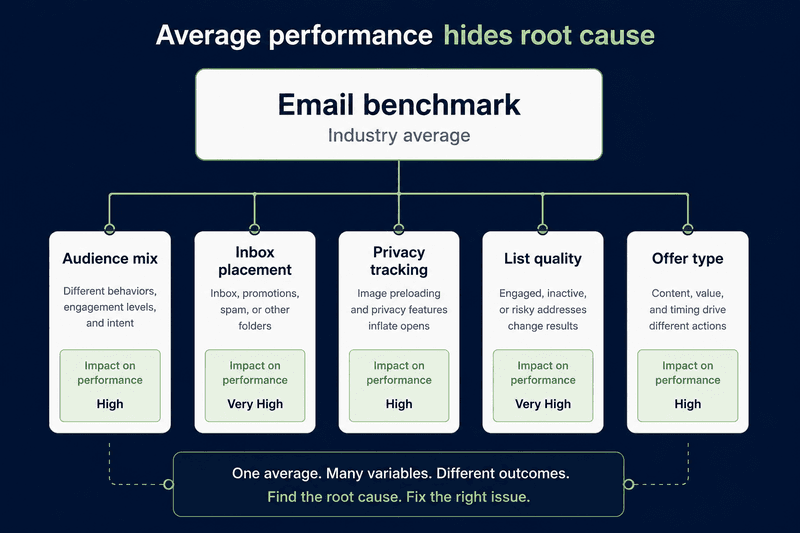
The problem is that an email benchmark only tells you how other organizations performed under completely different conditions. It doesn't account for your audience, your sender reputation, your authentication setup, your inbox placement, or the quality of your email list. Two companies can report the same open rate while experiencing very different business outcomes.
As mailbox providers continue to evolve, privacy features change how engagement is measured, and deliverability becomes more dependent on sender reputation than ever before, relying on generic benchmarks can lead teams to solve the wrong problems. Instead of asking whether your metrics match an industry average, a better question is whether your email performance is improving over time and what is actually driving those changes.
In this guide, we'll explain why the traditional email benchmark is often a poor indicator of success, where public benchmarks still have value, and how to build a measurement framework that leads to better decisions and stronger email performance.
Why Marketers Rely on Benchmarks
Email benchmarks feel useful because they give CMOs, growth teams, and marketers a fast comparison point in the market. When a team lacks internal context, an industry average can look like a shortcut to performance judgment.
That shortcut is risky. A benchmark does not know your audience, inbox placement, list source, sending frequency, mailbox provider mix, offer type, or lifecycle stage. It compresses different businesses into one number and asks your team to make decisions from it.
Featured answer: Email benchmarks are reference points, not targets. They become misleading when teams use average open rates, click rates, ctrs, ctors, or email KPI benchmarks (including email marketing benchmarks 2025 and other “key email engagement rate benchmarks”) to judge success without internal trends, cohort data, inbox placement, sender health context, and customer data quality.
The Problem With Industry Averages
Most ranking benchmark content still centers tables of average rates. That format is easy to scan, but weak for decisions—especially when teams are trying to automate marketing across more channels (email sms, mobile push, and in-app) and compare fundamentally different motions like transactional messaging vs. lifecycle email campaigns.
| Benchmark type | Why it misleads | Better comparison |
|---|---|---|
| Industry average open rate | Privacy features and image loading can inflate opens | Internal open trend by segment |
| Average click rate | Audience intent varies by offer and lifecycle stage | Click trend by campaign type |
| Delivery rate | Delivery does not prove inbox placement | Inbox placement by provider |
| Email KPI benchmarks | Generic metrics hide root causes | Sender health plus cohort outcomes |
Open rate is especially fragile. Apple Mail Privacy Protection can download remote content without direct user engagement. Gmail image preloading can also distort tracking. That is why average open rates misleading is not just an opinion. The measurement input itself can be unreliable—even when a dashboard says you’re getting “good open rates.”
Why Benchmarks Hide Real Problems
A campaign can beat email performance benchmarks while still having deliverability problems. A campaign can also miss a public average while doing exactly what it should for a narrow, high intent audience.
The real danger is false confidence. Teams may see “above average” numbers and ignore declining inbox placement, rising complaints, weak list hygiene, poor provider level performance, or problems introduced upstream (like a misconfigured smtp relay that hurts reputation and throttles real-time email delivery).
This is common when teams stitch together tools for smarter marketing—CRM, sales management, sales automation, and ESPs—without full data control, custom pipelines, or consistent list governance across email lists.
Delivery Rate Versus Deliverability
Delivery rate means the message was accepted by the receiving server.
Deliverability means the message reached the inbox rather than spam or another filtered location.
GlockApps correctly distinguishes delivery from inbox placement, but its related content often moves toward tactical product led fixes. The larger gap is executive decision design: how to replace generic email benchmarks with a repeatable internal measurement system.
What Actually Matters Instead
Modern email performance needs decision intelligence, not generic averages—especially for teams running automated multichannel customer journeys across multiple channels and devices (including mobile), and trying to connect performance back to revenue and customer loyalty.
Track these signals together:
- Inbox placement by mailbox provider
- Internal trend by campaign type (newsletters, lifecycle, real-time email triggers, transactional messaging)
- Segment level clicks and conversions
- Complaint rate and unsubscribe behavior
- SPF, DKIM, and DMARC status
- Sender reputation and domain health
- Cohort performance over time
- Business outcome per audience group (including revenue per segment, repeat purchase, and loyal fans)
This is where Mailora’s positioning fits the topic. Mailora is described as an inbox placement and email deliverability intelligence platform focused on clarity, diagnosis, granular seed mailbox visibility, health score aggregation, Google Postmaster visualization, and multivariate testing. That supports a stronger benchmark replacement model: diagnose why performance changed instead of asking whether a generic average was beaten.
How to Build Your Own Benchmarks
Use this framework instead of public averages.
Step 1: Separate campaign types
Do not compare newsletters, product updates, onboarding flows, sales offers, and reactivation campaigns in one pool. Also separate lifecycle vs. transactional messaging (password resets, receipts) and retail ecommerce promotions (seasonal offers, integrated rewards program updates).
Step 2: Build historical baselines
Create internal baselines for each campaign type over a consistent period. Track open trend, click trend, conversion trend, complaint rate, unsubscribe rate, and inbox placement.
Step 3: Segment by audience
Separate new subscribers, active buyers, inactive users, leads, customers, and high value accounts. If you support small business entrepreneurs or small business run campaigns, keep segments clean so you can identify what’s working by intent—not by broad averages.
Step 4: Add provider level diagnosis
Compare Gmail, Yahoo, Outlook, and other mailbox provider outcomes. A total average can hide one provider failing.
Step 5: Connect metrics to decisions
Every metric should answer one operational question.
| Decision question | Best signal |
|---|---|
| Are we reaching the inbox | Inbox placement |
| Is the list healthy | Complaints, bounces, unsubscribes |
| Is content creating action | Clicks and conversions |
| Is tracking distorted | Open rate variance by client |
| Is authentication stable | SPF, DKIM, DMARC, DNS status |
Technical Breakdown: Standards That Affect Email Benchmarks
Mailbox provider rules now shape performance reporting. Google treats senders near 5,000 or more daily messages to personal Gmail accounts as bulk senders and requires SPF, DKIM, DMARC, TLS, aligned From domains, one click unsubscribe for marketing mail, fast unsubscribe processing, and low spam rates.
Yahoo requires authentication, low complaint rates, valid DNS, RFC compliance, one click unsubscribe for bulk senders, and DMARC with at least p=none. Microsoft also expects SPF, DKIM, and DMARC alignment for large senders to Outlook consumer services.
These requirements matter because weak authentication or poor complaints can change inbox placement before your campaign metrics explain why. They also raise operational expectations around enterprise-grade security and governance when customer data flows across multiple tools and channels.
Diagnostic Checklist
Use this before comparing any campaign to email KPI benchmarks.
| Check | Pass criteria |
|---|---|
| Authentication | SPF, DKIM, and DMARC pass and align |
| Inbox placement | Tested across major mailbox providers |
| Complaint risk | Low and monitored by provider |
| List source | No bought lists |
| Opt out process | Clear and processed quickly |
| Segment trend | Compared against its own history |
| Cohort quality | New, active, inactive, and customer groups separated |
| Business outcome | Clicks, conversions, or revenue tied to audience intent |
Tool Comparison: Mailora And GlockApps
Benchmarks also get distorted by tooling differences. An ESP optimized for “design emails yourself” newsletters behaves differently than a stack built for custom solutions, tailored onboarding, and automated multichannel customer journeys. If you’re integrating tools via zapier, make sure event timing and deduping rules don’t create false lifts in clicks or conversions.
| Area | Mailora | GlockApps |
|---|---|---|
| Core emphasis | Deliverability intelligence and actionable diagnosis | Broad deliverability testing suite |
| Visible strengths | Granular seed visibility, health score, Google Postmaster visualization, multivariate testing | Mature content library, spam testing, DMARC analytics, uptime monitoring |
| Content gap opportunity | Own benchmark replacement through decision intelligence | Strong tactical coverage, less complete executive benchmark framework |
| Best fit | Teams that need clarity on why performance changed | Teams seeking broad testing and deliverability tooling |
ROI Impact Analysis
A misleading benchmark can push teams toward the wrong fix. If opens look weak, they may rewrite subject lines when the real issue is inbox placement. If clicks look strong, they may miss rising complaints. If delivery rate looks healthy, they may ignore spam folder placement.
The ROI impact is not a fabricated universal percentage. It depends on list size, revenue model, campaign mix, and conversion value. What can be verified is the decision risk: wrong metrics lead to wrong diagnosis—and that risk grows as your stack expands into sales automation, customer loyalty programs, and cross-channel orchestration.
Myth Corrections
| Myth | Correction |
|---|---|
| Delivery rate equals deliverability | Delivery only confirms server acceptance |
| Open rate proves engagement | Privacy and preloading can distort opens |
| Authentication guarantees inboxing | Complaints and wantedness still matter |
| Industry average equals target | Internal segment trends are stronger |
FAQ
What are email benchmarks?
Email benchmarks are reference averages for email metrics such as open rate, click rate, conversion rate, unsubscribe rate, and complaint rate.
Why are average open rates misleading?
Average open rates are misleading because privacy features and image preloading can record opens without confirmed human engagement.
Are email performance benchmarks useless?
No. They are useful for broad context, but weak as targets. Internal trends are better for decisions.
What should marketers track instead of open rate?
Track inbox placement, clicks, conversions, complaints, unsubscribes, sender reputation, and segment level trends.
What is the difference between delivery and deliverability?
Delivery means the receiving server accepted the message. Deliverability means the message reached the inbox.
How do you build internal email benchmarks?
Group similar campaigns, segment audiences, track historical trends, add provider level inbox placement, and connect metrics to business outcomes.
Should CMOs use email KPI benchmarks?
CMOs can use them for context, but strategic reporting should focus on trends, risk, and revenue linked outcomes.
Where does Mailora fit?
Mailora supports teams that need deliverability diagnosis, inbox placement visibility, sender health context, and clearer decisions from email performance data.
Use Mailora When Benchmarks Stop Explaining Performance
When email benchmarks stop answering why performance changed, teams need diagnosis. Mailora helps connect inbox placement, sender health, spam filter signals, Google Postmaster data, and campaign testing into a clearer operating view.
In practice, teams often compare this diagnostic approach against what they see in “all-in-one” engagement stacks and ESP dashboards—campaign monitor, sap engagement cloud, and brevo data platform unify—plus creator and SMB tools that emphasize speed over depth (including track - mailerlite). Each can support timely emails and automated journeys, but the benchmark mistake stays the same: averages don’t explain causality.
For deeper guidance, explore the Mailora blog on email deliverability, Mailora blog on inbox placement, and Mailora blog on sender reputation.
Stay in the loop
Deliverability insights, product updates, and early access to new features. No spam, unsubscribe anytime.
By subscribing, you agree to our Privacy Policy. Unsubscribe anytime.